After a few weeks of relative calmness, solar activity picked up again with some M-class flares and especially the eruption of some of the many filaments that were visible on the solar disc. Solar filaments are clouds of charged particles ("plasma") above the solar surface squeezed between magnetic regions of opposite polarity. Being cooler and denser than the plasma underneath and their surroundings, they appear as dark lines when seen on the solar disk. Special filters are required to observe these features, such as in the Hydrogen-alpha (H-alpha) line in the red part of the solar spectrum at a wavelength of 656.3 nm. The annotated H-alpha imagery underneath is from the GONG network and displays the 3 relevant filament eruptions on 31 October, 2 November and 3 November. Each time, the situation prior to, during and after the eruption is shown.
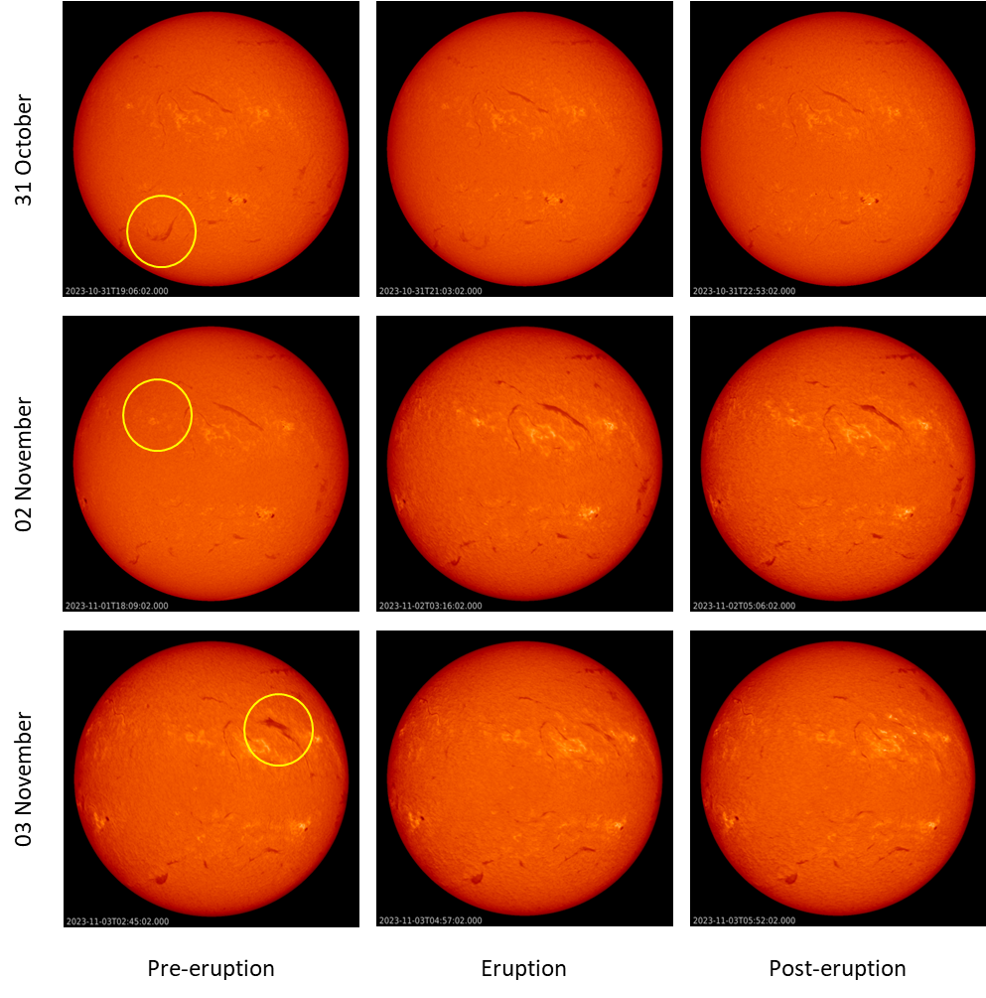
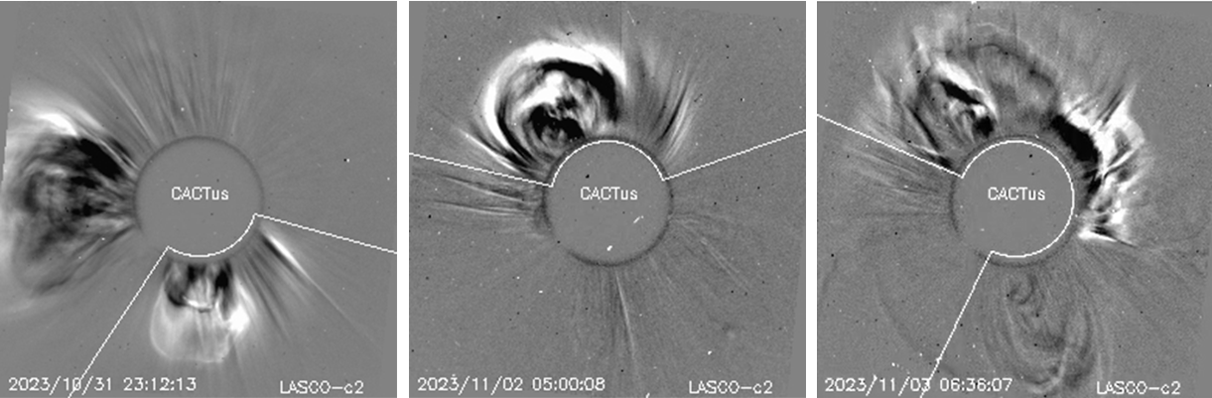
The first event is a typical by-the-book filament eruption, occurring in the southeast solar quadrant late on 31 October. From an analysis with the CACTus tool, the SIDC space weather forecaster judged that the resulting coronal mass ejection (CME - see the SOHO/LASCO imagery underneath) might have an earth-directed component, though the bulk of the CME was being directed south of the Sun-Earth line. The second eruption took place on 2 November and was a lot more interesting. In the H-alpha images, there's actually no filament to be seen in the location prior to the eruption! In fact, this concerned the eruption of an empty filament channel. The filament channel is thought to be the magnetic structure within which usually lies the filament plasma. However, not all filament channels are filled with filament plasma, even though the observation of such empty filament channels is quite rare. In certain cases only segments of a filament are seen along the same polarity inversion line, i.e. an imaginary line separating areas of positive magnetic polarity from negative magnetic polarity. An empty filament channel is thought to be part of the filament formation process (Parenti S. ; 2014). The CME associated with this rare type of eruption was also judged to have an earth-directed component.
Finally, during the morning hours of 3 November, the most violent of the 3 filament eruptions took place. The post-eruption coronal loops remained visible in extreme ultraviolet (EUV) imagery (SDO/AIA 094) several hours after the event in H-alpha had already ended (see the imagery underneath). It concerned the largest of the 3 filaments (about 30 degrees), and the size of the eruption itself reached all the way to the solar equator. Being so violent and located in the western solar hemisphere, the event slightly enhanced the greater than 10 MeV proton flux above its background values, but remained below the alert threshold.
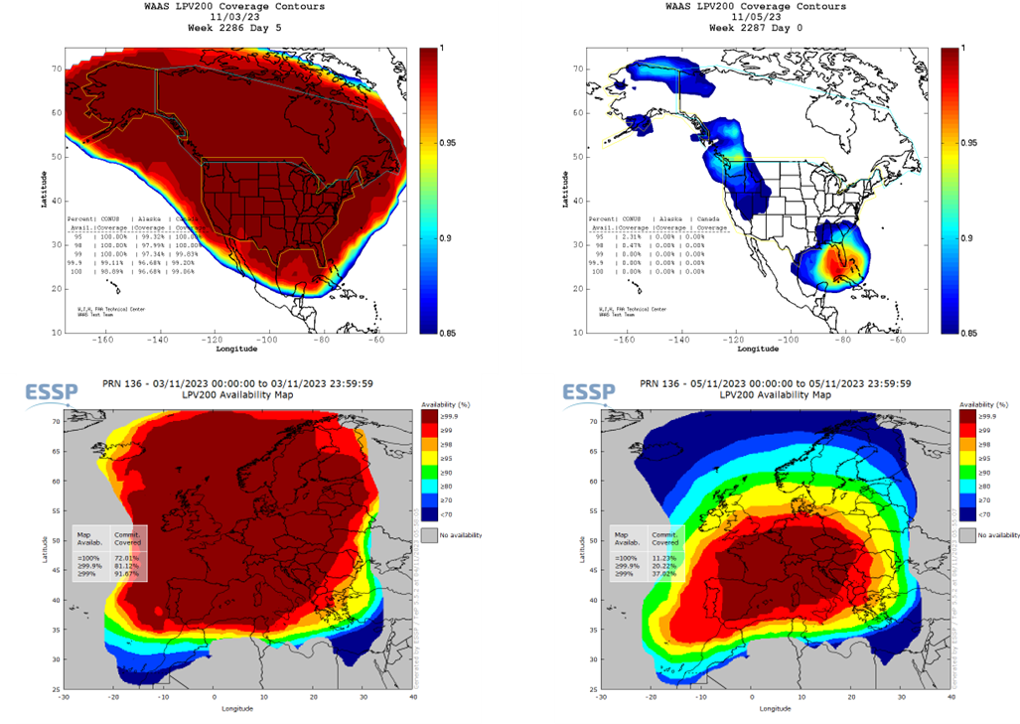
All 3 CMEs were thought to be directed to Earth, and sure enough they all 3 arrived and this within SIDC the forecast uncertainty margins. The first CME arrived around noon on 4 November, sparking only a brief minor geomagnetic storm (DSCOVR). The two other CMEs arrived within a few hours of each other on 5 November, with shocks observed by DSCOVR at 08:13 and 11:48 UTC. The north-south component of the interplanetary magnetic field dipped to -27nT, a value not often seen so far this solar cycle. This one-two punch delivered to the earth's magnetic field resulted in a major geomagnetic storm, with the Kp index reaching 7 (on a scale from 0 to 9), the Disturbance storm-time index reaching -165 nT (WDC Kyoto), making it into the top 3 of strongest storm this year together with the famous storms in March and April. Deep red aurora were photographed from Belgium and locations as far south as Arizona and Texas in the USA, and Portugal and Italy in Europe (Spaceweather.com Realtime Aurora Photo Gallery). For civil aviation, some advisories were issued for depressed maximum useable frequencies in the 3 to 30 MHz (HF) range. Certain satellite-based applications for aviation in Europe (EGNOS) and USA (WAAS) were affected too as shown in the availability maps underneath for an undisturbed day (left) and on 5 November. A red color in this case means good coverage and availability...